Expected Use Maps
GIS Expected-use maps that predict livestock use patterns for large rangeland areas can reduce costs and improve the efficiency of rangeland planning efforts. The development of Expected-Use maps is described in the following article that has been published in the April 2000 Society for Range Management publication Rangelands.
Download this article in PDF format
Expected-Use GIS Maps
Keith S. Guenther
The ability to identify and map areas cattle are expected to utilize heavily and areas cattle may avoid will reduce the time required to establish realistic objectives. There are many factors that cause cattle to typically utilize forage in an uneven manner. Distance to water and steepness of slope are two site factors that are known to strongly affect uniform utilization of forage. A GIS/Analysis system was used to develop maps based on a combination of slope and distance to water that predicts the level of forage utilization by cattle. The maps have been effectively used to facilitate several planning and analysis tasks that are often time consuming.
Development of Expected-use map
The Idrisi GIS/Analysis system (The Idrisi Project, Clark University, Worcester, Mass.) was used to create a model and the resulting expected-use maps. Suitability values for slope and distance to water were based on published guidelines (Heady 1994, Holechek 1998) and local knowledge.
The expected-use maps were created with 5 classes of expected forage use that correspond to classes commonly used when mapping forage utilization:
- Incidental use areas
- Areas that are expected to receive 0-5% use.
- Slight use areas
- Areas that are expected to receive 5-20% use.
- Light use areas
- Areas that are expected to receive 20-40% use.
- Moderate use areas
- Areas that are expected to receive 40-60% use.
- Concentration areas
- Areas that are expected to exceed 60% use.
The expected-use map is produced by first creating two separate GIS map coverages of grazing suitability based on slope and distance to water. The two grazing suitability coverages are then combined to create the expected-use map. The authors created an easy to use computer program that requires only three map coverages or data layers to derive the expected-use map using the Idrisi GIS/Analysis system. The coverages needed are:
- Slope map of the analysis area (raster format)
- Water sources coverage (digitized vector format)
- Perimeter or boundaries of the pasture being analyzed (digitized vector format)
A USGS Digital Elevation Map (DEM) of the analysis area was utilized to derive a slope map. The Idrisi GIS/Analysis system then assigned a suitability value for slope of between 0%-100% suitable to each pixel within the analysis area. The grazing suitability-slope coverage map was based on the assumption that slopes less than 6% were 100% suitable for cattle use, and areas with slopes over 60% were 0% suitable for cattle use. Intermediate slopes were given intermediate values with a slope of 33% being considered 50% usable. The expected-use computer program can be easily adjusted to use different slope values for suitability.
A water source map was created and utilized as the basis for development of a distance to water map. The Idrisi GIS/Analysis system then assigned a suitability value for water of between 0%-100% suitable to each pixel within the analysis area. The grazing suitability-water map was based on the assumption that distances to water up to 250 yards were 100% suitable and areas beyond 2 miles were 0% suitable for cattle use. Intermediate areas were given intermediate values with a distance of 1mile being considered 50% suitable. The expected-use computer program can be easily adjusted to use other distance to water values for suitability.
The map coverages for suitability based on slope and suitability based on distance to water were then combined into a single coverage that provided an estimate of combined suitability, or expected-use, for cattle. The computer program provides an infinite number of suitability values between 0% and 100% suitable, as both slope and distance to water are suitable on a relative basis. To simplify the analysis and comprehension of data, the data was reclassed into five classes of expected-use. The concentrated use class was assigned to all areas with slopes less than 6% and within 250 yards of water which were assumed to be 100% suitable. Areas with values of 70-100% were predicted to have moderate expected-use, areas with 35-70% suitability were predicted to have light expected-use, and areas with suitability values of 5-35% were predicted to have slight expected-use. Areas that had a combined value of less than 5% suitable because of excessive slope, distance to water, or a combination of the two, were placed in the incidental use class.
How Expected-Use maps can be utilized
- Identification of areas suitable for location of key area and trend transects:
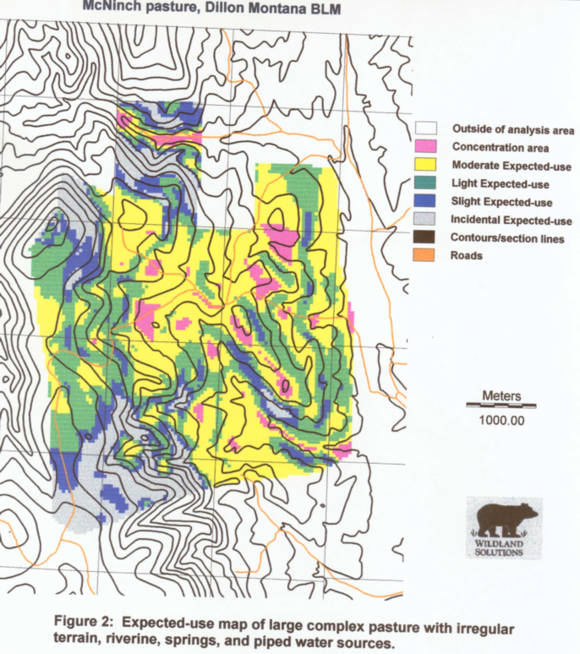
- Key area and trend transects are generally established in areas that are expected to receive moderate livestock use. Good locations for key area and trend transects can be readily identified within the areas of expected moderate use, shown as yellow in Figures 1 and 2.
- As a base map for creating a use pattern map:
- Use pattern mapping can be conducted more efficiently with the aid of the expected-use map. Topographical features that influence livestock use patterns such as slope breaks and relative distance to water are already identified and displayed with the computer generated expected-use map.
- Identification of areas with high potential for impacts to sensitive resource values:
- Areas of potential conflict with livestock use can be determined from the expected-use map. Concentration areas with high levels of livestock use can be readily identified (Figures 1 and 2). The concentration areas that are identified in pink can then be surveyed for potential conflicts with wildlife, plants, and archeological values. A significant reduction in time spent surveying sensitive wildlife areas, plant populations, and archeological sites may be achieved since moderate use areas can often be surveyed at a lower intensity, and sensitive areas located within light, slight, or incidental use areas may need only a cursory level survey.
- Identification of areas for placement of salt or supplements:
- Most recommendations for placement of salt or supplements include criteria to avoid placement near water. The expected use maps in Figures 1 and 2 clearly show the concentration areas near water that need to be avoided. Salt and supplements are frequently utilized to aid cattle distribution. The best locations for placement of salt or supplements would be the areas expected to receive light or slight use shown as green and blue on the expected-use map.
- Estimation of Grazing capacity:
- Determining the estimated carrying capacity of a pasture that includes areas with steep slopes or that are a long distance from water is commonly required. Identifying areas of steep slope and distance to water before making adjustments to the carrying capacity is a complex and time consuming process using traditional mapping and analysis techniques. The expected-use map can be utilized to determine the acreage in each expected-use class and then by using a weighted average the rangeland manager can quickly determine the average expected-use of forage for a pasture.
Summary
- Computer assisted GIS/Analysis allows rangeland managers to create site specific expected-use maps that facilitate the efficient analysis and visual display of complex relationships such as slope and distance to water.
- The ability to better understand complex natural resource relationships helps rangeland managers develop realistic management strategies and make better site-specific decisions.
- Expected-use maps improve the effectiveness of a rangeland manager's planning and analysis efforts.
- The expected use maps assist in the efficient location of key areas for monitoring and the placement of salt and supplements.
- Determinations of carrying capacity and the development of use pattern maps are easier and more efficient when based on an expected-use map.
- The complex expected-use map would be prohibitive to develop without a computer assisted GIS/Analysis system. Even three to four years ago this type of analysis could only be conducted on large mainframe type of computers. The Idrisi GIS/Analysis system is a relatively low cost Windows based system that can be operated on most desktop PC systems.
- The computer program developed to create the expected-use maps using the Idrisi GIS/Analysis system can be obtained from the www.wildlandsolutions.com website.
Heady, F.H., and D.R. Child. 1994. Rangeland ecology and management. Westview Press, Boulder, CO.
Holechek, J.L., R.D. Pieper, and C.H. Herbel. 1998. Range management, 3rd ed. Prentice-Hall, Upper Saddle River, N.J.
Author:
Keith S. Guenther, Wildland Solutions, Brewster, WA, (keith @ wildlandsolutions.com).
Figure 1: Expected-use map of a pasture with a single water source and relatively gentle terrain.
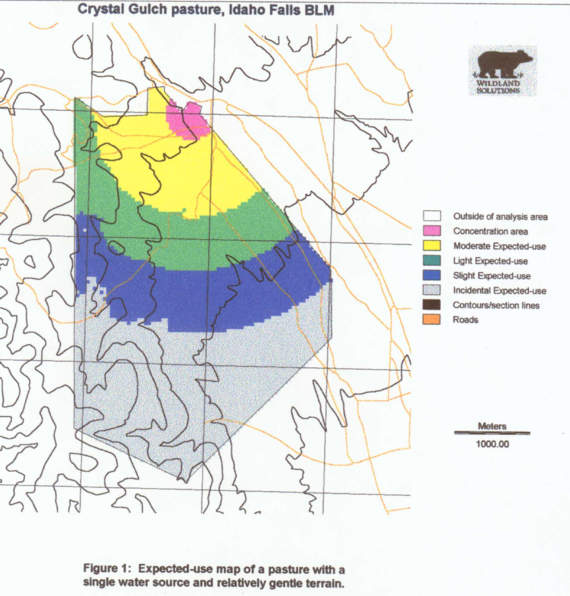
Figure 2: Expected-use map of a large complex pasture with irregular terrain, riverine, springs and piped water sources.